R exp has something wrong???
5 replies

Batch
6 years ago #117274
Hi,
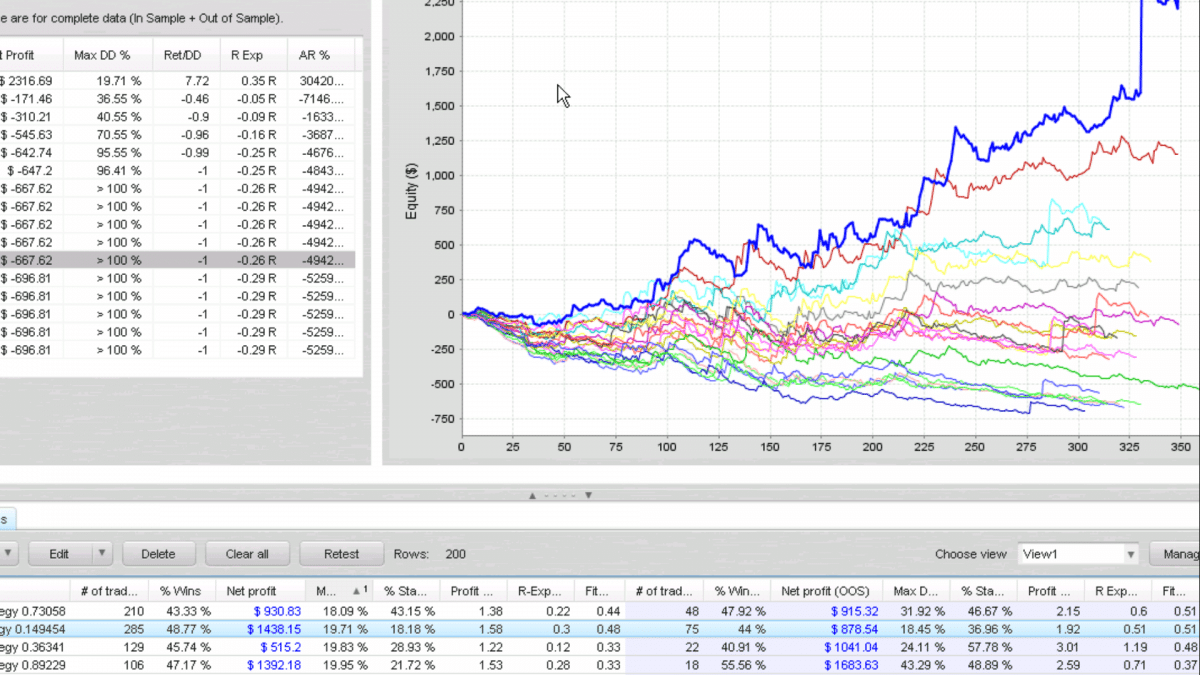
I attach screenshot of robustness test of selected .str.
Why is it giving much higher figures for R-exp in selected area while as seen above in both columns info and chart it’s so bad actually?
I hadn’t run SQ for long time but I don’t recall the robustness tests conflicting in its reporting. Am I interpreting wrong or doing something wrong? Or has my SQ corrupted from long time cobweb collections?, Lol.
Jerry
 Screenshot_2017-05-23-10-42-55.png
Karish
6 years ago #143839
Dont know about the R-Exp but the strategy is clearly not robust,
maybe you use tough settings in your montecarlo settings?

qattack
6 years ago #143855
I’m not sure what your speaking of… Your Robustness Test stats are highly negative for the 50%+ range, and so are the charted simulations. Your IS and OOS results are positive. The graph shows 16 runs (plus your IS and OOS). Look at run #9, which corresponds to the “50%” result in the statistics. but it looks like you ran the trials using a very small or null account balance.
@Karish: I don’t think Batch was commenting on the robustness of the strategy, only the R-Exp stat.
That said, I’ve been thinking about posting a bug report on R-Exp for a couple days. When I run MC tests, sometimes R-Exp is positive, but R/DD and Net Profit are negative. I’m not sure if this has something to do with having multiple runs congregated within the same stats in the chart.
Also, when comparing two similar strategies, sometimes a strategy with a significantly higher R-Exp has a much lower R/DD and Net Profit than the other. I could just be misinterpreting results as well…
Batch
6 years ago #143879
I thought R exp is indicative of how robust, no?
Mark, hope you can study what may be wrong here for SQ4.
qattack
6 years ago #143888
R-Exp is one stat that you use to help determine robustness (it’s the first stat I pay attention to).
In your example, note your actual historical run (the first line of the chart) showed a nice R-Exp of 0.35. The very next line shows confidence of 50%…the chart does not display 10%, 20%, 30%, 40%…so you are not seeing the “good” results depicted in the graph.
The MC tests showed that the historical run is an outlier (much better than the norm) and the system would be expected to do much worse over a large number of similar periods.
Batch
6 years ago #143908
No entry
Viewing 5 replies - 1 through 5 (of 5 total)