About Stability
10 replies

jialin cheng
7 years ago #116219
What is stability in overview? How is this figure comes up?
tomas262
7 years ago #141148
Hello,
it is a proprietary formula which uses linear regression. It basically evaluates how straight the equity is. If it was a straight rising line it would be Stability = 1

MFM
7 years ago #141428
Greetings Tomas,
I was comparing str result between SQ & QA, sorting them by stability. While other statistics looks OK, stability is quite different,
I’ve attached the screenshot and one of the str here.
The attached str shows a 0.9 stability in SQ, but in QA shows only 0.69
Austin
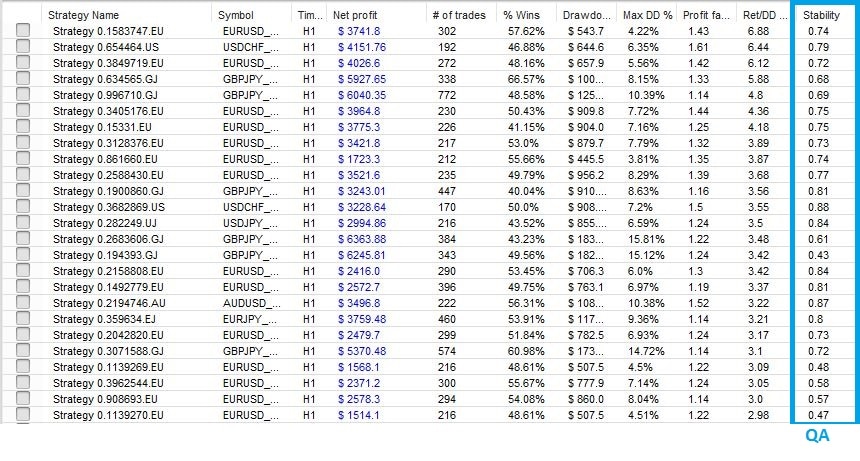 QA.JPG
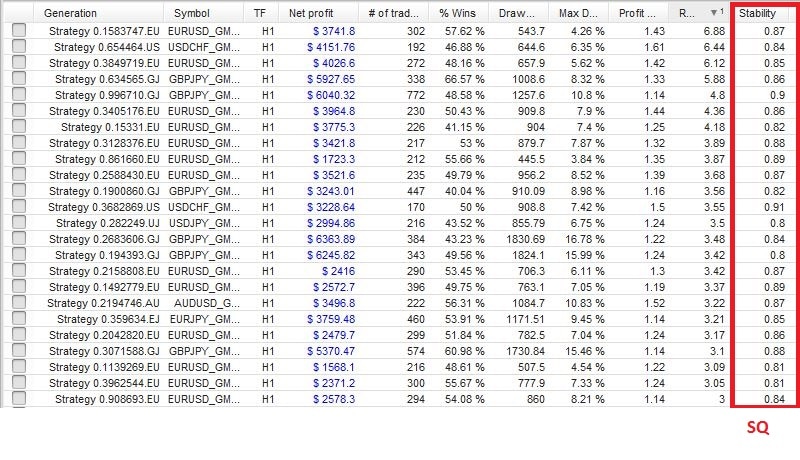 SQ.JPG
Gui
7 years ago #141440
Greetings Tomas,
I was comparing str result between SQ & QA, sorting them by stability. While other statistics looks OK, stability is quite different,
I’ve attached the screenshot and one of the str here.
The attached str shows a 0.9 stability in SQ, but in QA shows only 0.69
Austin
Interesting to know if the calculation is different between both or if the trade counts snippet interfere somewhere. Thanks for raising the issue.
Think different
tomas262
7 years ago #141485
tomas262
7 years ago #141539
Hello,
the Stability in SQ on your screenshot is probably the Stability (In-Sample) while in QA it takes (In-Sample+ Out Of Sample) into consideration hence the difference
MFM
7 years ago #141589
Thanks Tomas.
The str was created using in/out sample, in sample between 2006 – 1st Jul 2012, out of sample was set between 2nd Jul 2012 – 2015.
I retest the str again with 100% in sample data between 2012-2016, save it as another file and open up again on SQ and QA.
So there is no out of sample period calculation for QA.
Which is accurate? SQ or QA.
Austin
MFM
7 years ago #142145
Hi,
I guess there is no answer to my query? Which result should i trust, QA or SQ?
And i did a test on SQ.
The stability calculation itself in SQ between IS & OOS is in-consistence. See attached.
IMO none is to be trusted. I have to stop using stability.
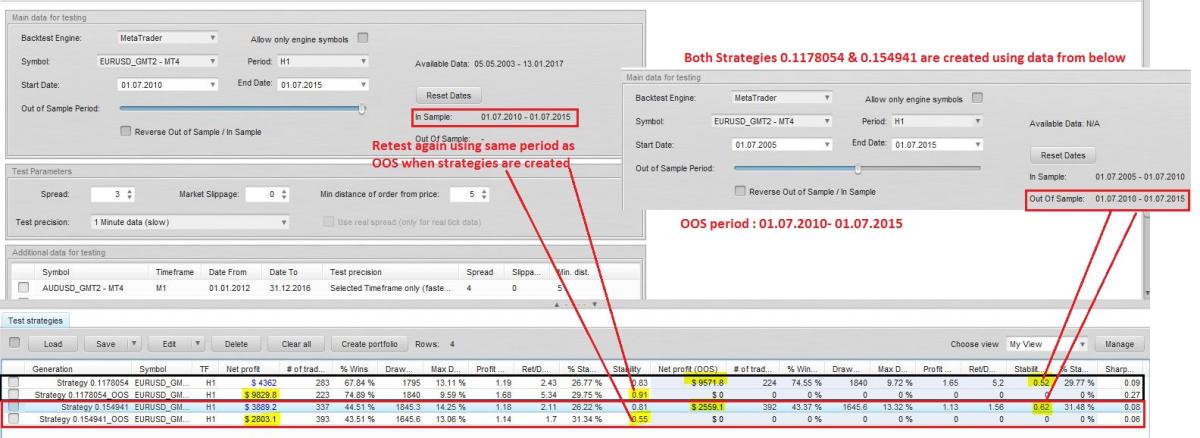 Capture.JPG
MFXS
7 years ago #142155
If you run the same strategy on the same date range in SQ and QA with no out of sample data – is there a difference?
MFM
7 years ago #142177
This is what sparks me to bring up this issue earlier. Retest STRs are all 100% in sample with same date range, and there is differences.
tomas262
7 years ago #142196
Hello,
yes, I also see small differences in stability value for the same periods of data. It can be caused by the stabiity formula itself for some reason. It uses regression and other indicators. Mark has been notified about this
Viewing 10 replies - 1 through 10 (of 10 total)