Analysis Chart: Basic Distribution
2 replies

seaton
8 years ago #114157
Have been playing around with some Analysis chart extensions tonight
Result is very basic Profit Distribution Chart.
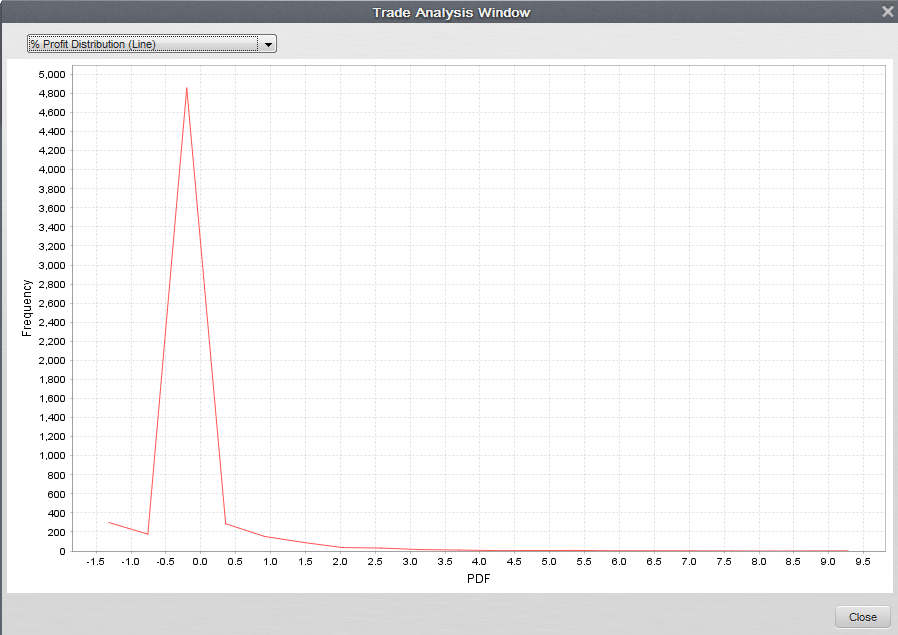 2015-08-27_2307.png
I need a way to do bin range for the histogram. PS also ignore the Axis labels as I’m playing around here
Mark: Can you please a SQChart wrapper around the JFreeChart Histogram Chart so SQ can do proper histogram charts? At the moment I’m using Line graph instead.
/* * Copyright (c) 2015, StrategyQuant - All rights reserved.
 *
 * Code in this file was made in a good faith that it is correct and does what it should.
 * If you found a bug in this code OR you have an improvement suggestion OR you want to include
 * your own code snippet into our standard library please contact us at:
 * http://tasks.strategyquant.com/projects/snippets/
 *
 * This code can be used only within StrategyQuant products.
 * Every owner of valid (free, trial or commercial) license of any StrategyQuant product
 * is allowed to freely use, copy, modify or make derivative work of this code without limitations,
 * to be used in all StrategyQuant products and share his/her modifications or derivative work
 * with the StrategyQuant community.
 *
 * THE SOFTWARE IS PROVIDED "AS IS", WITHOUT WARRANTY OF ANY KIND, EXPRESS OR IMPLIED,
 * INCLUDING BUT NOT LIMITED TO THE WARRANTIES OF MERCHANTABILITY, FITNESS FOR A PARTICULAR
 * PURPOSE AND NONINFRINGEMENT. IN NO EVENT SHALL THE AUTHORS BE LIABLE FOR ANY CLAIM, DAMAGES
 * OR OTHER LIABILITY, WHETHER IN AN ACTION OF CONTRACT, TORT OR OTHERWISE, ARISING FROM,
 * OUT OF OR IN CONNECTION WITH THE SOFTWARE OR THE USE OR OTHER DEALINGS IN THE SOFTWARE.
 *
 */
package com.strategyquant.extend.TradeAnalysisPanes;


import org.jfree.chart.JFreeChart;
import org.jfree.data.statistics.HistogramDataset;


import java.util.Arrays;
import java.util.List;


import com.strategyquant.lib.charts.common.SQLineChart;
import com.strategyquant.lib.language.L;
import com.strategyquant.lib.results.SQData;
import com.strategyquant.lib.results.SQOrder;
import com.strategyquant.lib.results.SQOrderList;
import com.strategyquant.lib.results.SQResultsGroup;
import com.strategyquant.lib.settings.SQConst;
import com.strategyquant.lib.snippets.TradeAnalysisChartPane;
import com.strategyquant.lib.time.SQTime;


public class PLDistributionChart extends TradeAnalysisChartPane {


public PLDistributionChart() {
this.name = L.t("% Profit Distribution (Line)");
}


@Override
public JFreeChart drawChart(SQResultsGroup strategyResult, SQData data) {
SQLineChart chart = new SQLineChart();
chart.xLegend = L.t("PDF");
      chart.yLegend = L.t("Frequency");

      HistogramDataset dataset = new HistogramDataset();

if(strategyResult==null) {
return chart.render();
}


     SQOrderList orderList = filterOrders(strategyResult, data);


 double[] trades = new double[orderList.size()];  // HistogramDataSet requires double[] as input.


     for(SQOrder order : orderList) {
         trades[orderList.indexOf(order)] = order.PctPL;
      }


    dataset.addSeries("Gain (%)", trades, 10);


      for(int index=0 ; index < dataset.getItemCount(0) ; index++){
        chart.add("Gain (%)", dataset.getXValue(0, index),dataset.getYValue(0, index));
      }


//chart.setIntegerRangeAxis(true);


return chart.render();
}
}
Regards,
Stephen…
seaton
8 years ago #132429
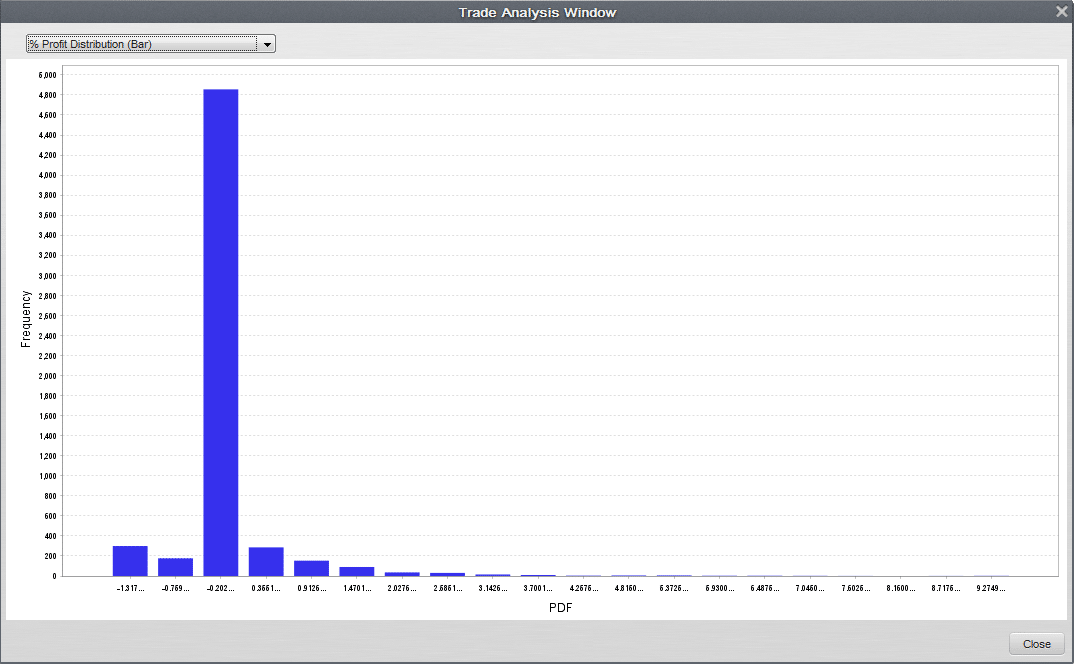 2015-08-27_2305.png
Tamas
8 years ago #132433
Hello seaton,
the method drawChart() returns a instance of JFreeChart.
You can create different type of charts by ChartFactory.
http://www.jfree.org/jfreechart/api/javadoc/org/jfree/chart/ChartFactory.html
JFreeChart chart = ChartFactory.createHistogram();
for more details see the link bellow or search for “ChartFactory.createHistogram”
http://www.roseindia.net/tutorial/java/jfreechart/createhistogram.html
Best regards,
Tomas
Viewing 2 replies - 1 through 2 (of 2 total)